S&P Global Market Intelligenceから入手可能なデータに基づき、米国の労災保険引受会社の2025年末の主要な業績についてまとめました。ミリマンの調査対象の労災保険引受会社は、2025年の労災保険元受保険料2億8,000万ドル以上の40の企業または企業グループで、2025年の労災保険業界全体の元受保険料総額の80%近くに相当します。ミリマンが確認した指標によると、元受保険料が2年連続で緩やかに減少したこと、2024年末と比較してした同年のロスレシオおよび弁護費用(DCCE)率のばらつきが高まったこと、過去の事故年のロスレシオは引き続き良好に推移していること、そして対象保険会社の資本ポジションがさらに強化されたことがわかりました。
以下の表および解説に示すとおり、労働者災害補償保険の近年の実績は良好です。しかし、社会・経済環境は変化しており、こうした変化は将来の労働者災害補償保険の保険料および損害に重大な影響を及ぼす可能性があります。具体的な変化としては、医療インフレの上昇、賃金の上昇、職場の安全プログラムにおけるロボティクスや人工知能(artificial intelligence、AI)の導入、ギグ・エコノミーにおける独立請負業者の補償範囲に関する法改正、ハイブリッド勤務環境における労働災害の定義をめぐる複雑化、ならびに職場関連の精神的傷害の補償範囲に関する新たな定義などがあります。労働者災害補償はロングテールの契約であるため、現在の環境は前年の損失に大きな影響を与える可能性があります。そのため、労災保険の実績は継続的にモニターする必要があります。
なお、今回対象とした保険会社のデータは、全米保険監督官協会(National Association of Insurance Commissioners、NAIC)のグループ提出資料が公表される前に、S&P Global Market Intelligenceによって集計されたものです。そのため、S&Pによる保険グループ合計と、今年後半にNAICのグループ提出資料に反映される業界および対象保険会社の合計との間に、差異が生じる可能性があります。なお、今回の複数の保険会社のデータは、過去の買収を反映して集計しているため、過去分のデータは現在のデータと同様の基準となるよう調整されていることに注意が必要です。
We are pleased to summarize key year-end 2025 financial results for U.S. workers’ compensation writers based on data available from S&P Global Market Intelligence. Milliman’s composite of workers’ compensation writers includes 40 companies or groups of companies, each with workers’ compensation direct written premium (DWP) of more than $280 million in 2025. This selected composite represents nearly 80% of the total workers’ compensation DWP volume for the industry in 2025. The metrics we reviewed show a second consecutive year of modest decline in DWP, a higher variability in the calendar year loss and defense and cost containment expense (DCCE) ratios relative to year-end 2024, a continuation of the persistent favorable development of prior accident years’ loss ratios, and further strengthening of the composite’s capital position.
As displayed in the following tables and commentary, recent experience for workers’ compensation has been favorable. However, the social and economic environment has changed, and these changes could have a material impact on future workers’ compensation premium and losses. Some of these specific changes include increased medical inflation, higher wage inflation, implementation of robotics and artificial intelligence (AI) in workplace safety programs, evolving legislation regarding coverage of independent contractors in the gig economy, complications with defining a workplace injury in hybrid work environments, and new definitions for coverage of workplace-related mental injuries. Because workers’ compensation is a long-tail line of business, the current environment could substantially impact prior-year losses. Therefore, workers’ compensation experience will need to be continually monitored.
It should be noted that the data for this composite of insurers have been aggregated by S&P Global Market Intelligence prior to National Association of Insurance Commissioners (NAIC) group filings being released. As such, there may be fluctuations in industry and composite totals between the S&P insurance group totals and those reflected by the NAIC group filings later this year. Also, the data for this composite have been aggregated to reflect any historical acquisitions, such that the historical data is on a basis similar to the current data.
DWP growth drops slightly for second consecutive year
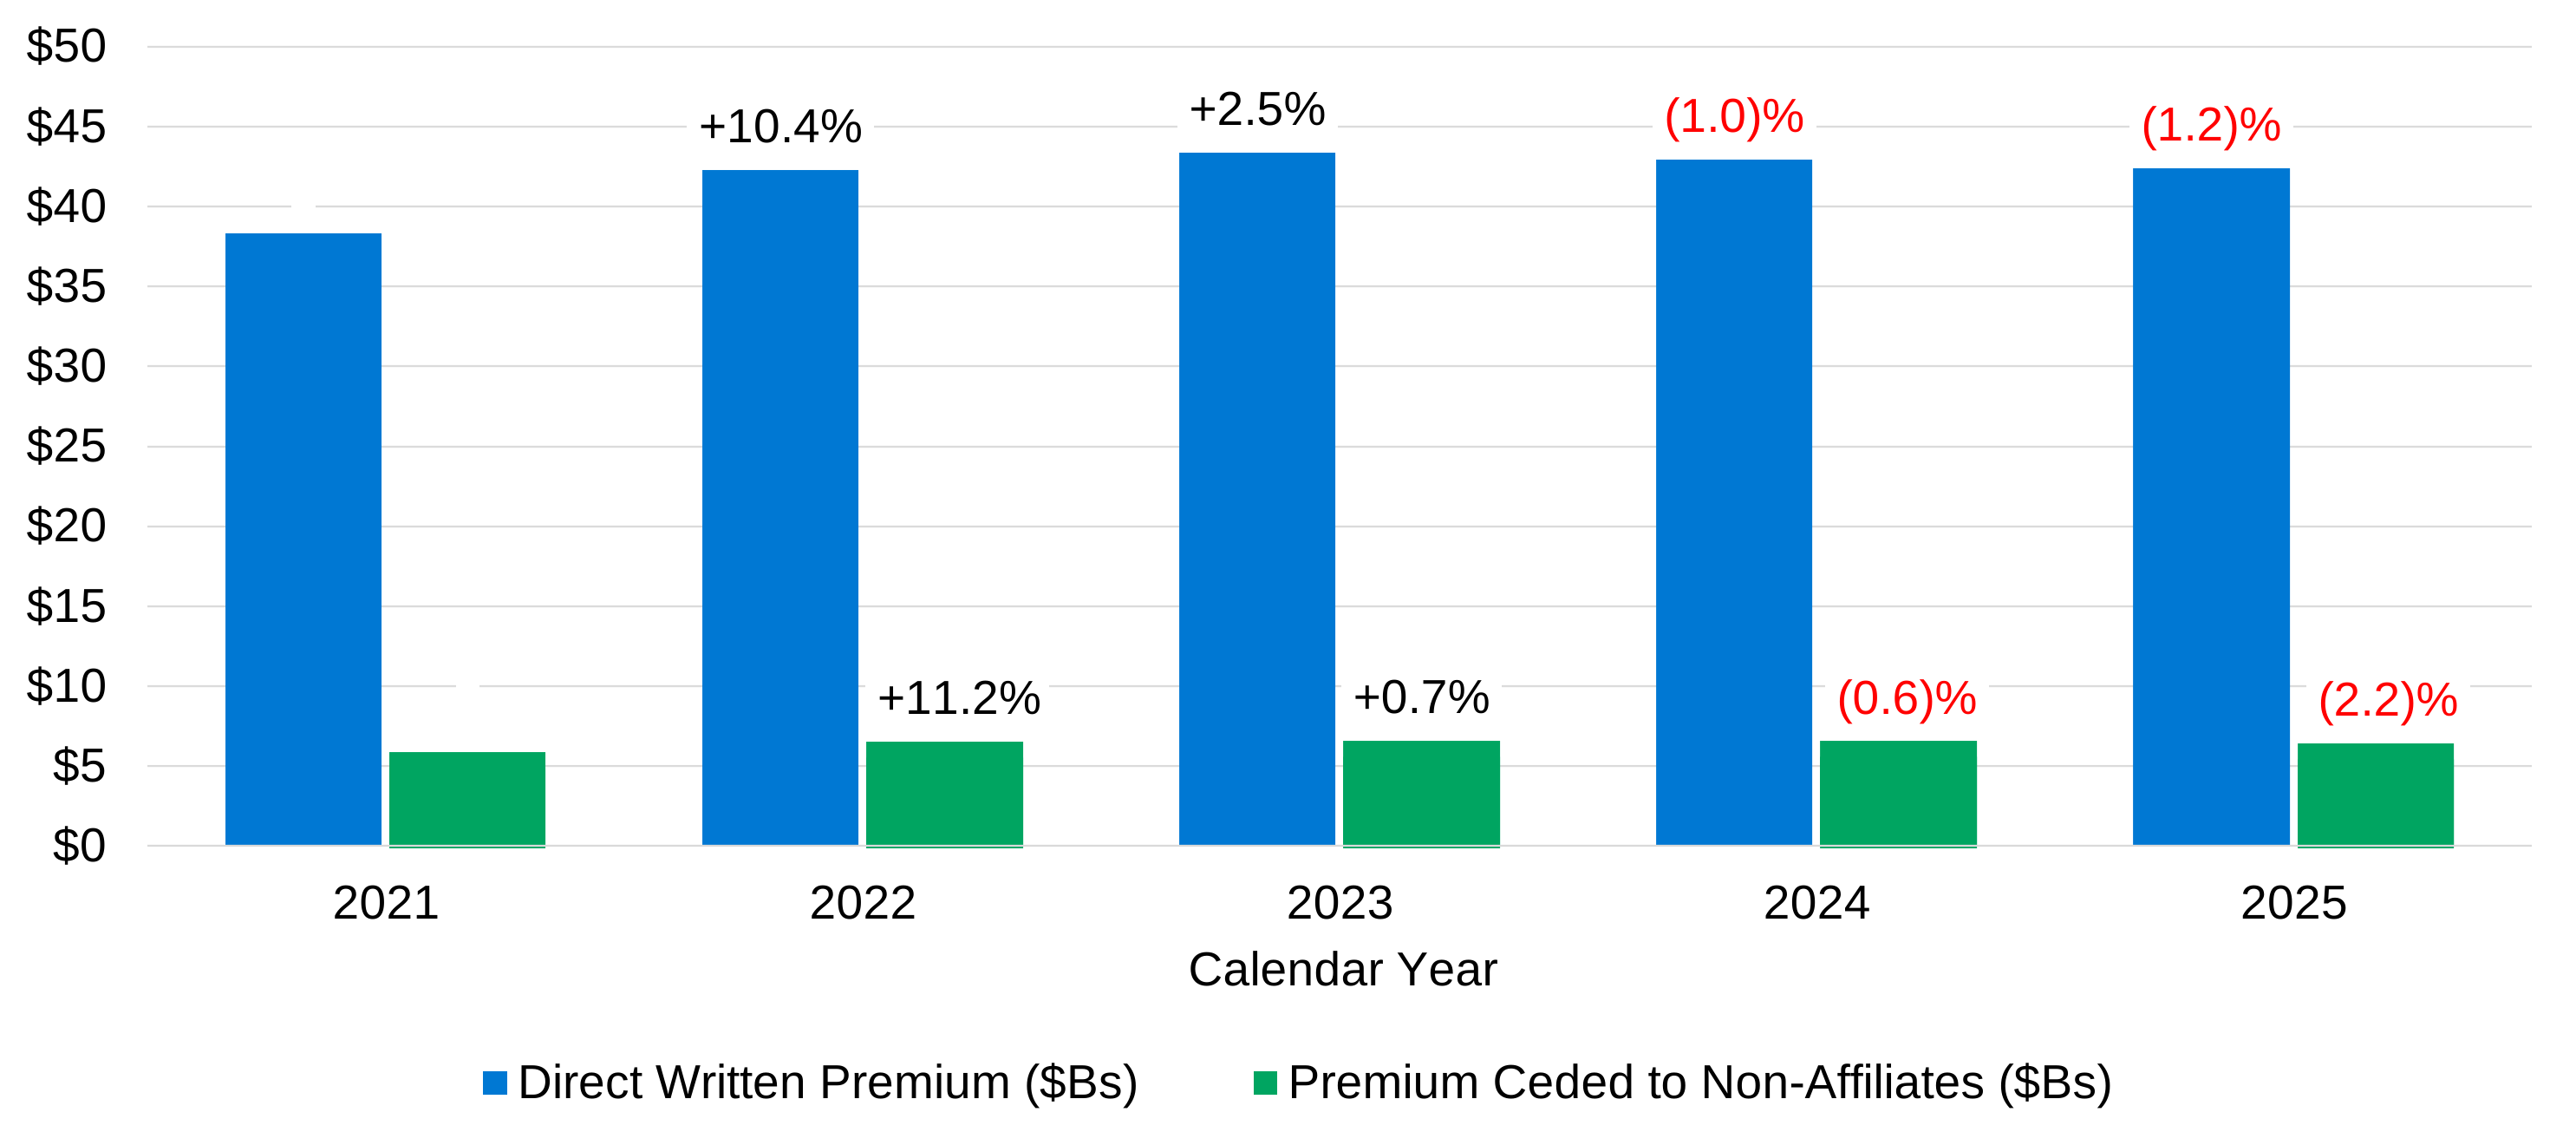
The industry saw another modest drop in DWP in 2025, continuing last year’s shift after three straight years of rising workers’ compensation DWP. The sharp increase in premium during 2022 was due to increased employment as the economy recovered from the pandemic, as well as increased wages due to inflation. As these effects eased gradually in 2023, so did the increase in total DWP. Other lines of business have seen recent increases in DWP due in part to rate increases in the last few years; however, workers’ compensation writers continue to see neutral or decreasing rate action driven by ongoing favorable frequency trends and wage trends offsetting medical and indemnity severity trends leading to a decrease in DWP in 2024 and 2025. Premium ceded to non-affiliates have held the same pattern as DWP the past few years. Figure 1 displays the total workers’ compensation DWP for this composite, along with the percentage change from the prior year.
Figure 1: Top 40 workers’ compensation writers – direct and ceded written workers’ compensation premium ($ billions)
Loss ratios starting to creep upward
The countrywide workers’ compensation 2025 calendar year loss and DCCE ratio (CYLR) for the industry, excluding monopolistic states, was 54.4%, a slight deterioration from the 53.8% observed in 2024. The deterioration in CYLR in 2025 was driven by a slightly higher initial accident year loss ratio in 2025 compared to 2024. Figure 2 shows the workers’ compensation CYLRs for each of the last five years on a countrywide basis and for several of the largest states, noting that the administration of workers’ compensation insurance varies by state (i.e., bureau rates, administered pricing, monopolistic states). When assessing the 15 largest states (based on 2025 direct earned premium), 10 states saw a deterioration in 2025 CYLR compared to 2024.
Figure 2: Workers’ compensation total industry – direct CYLRs
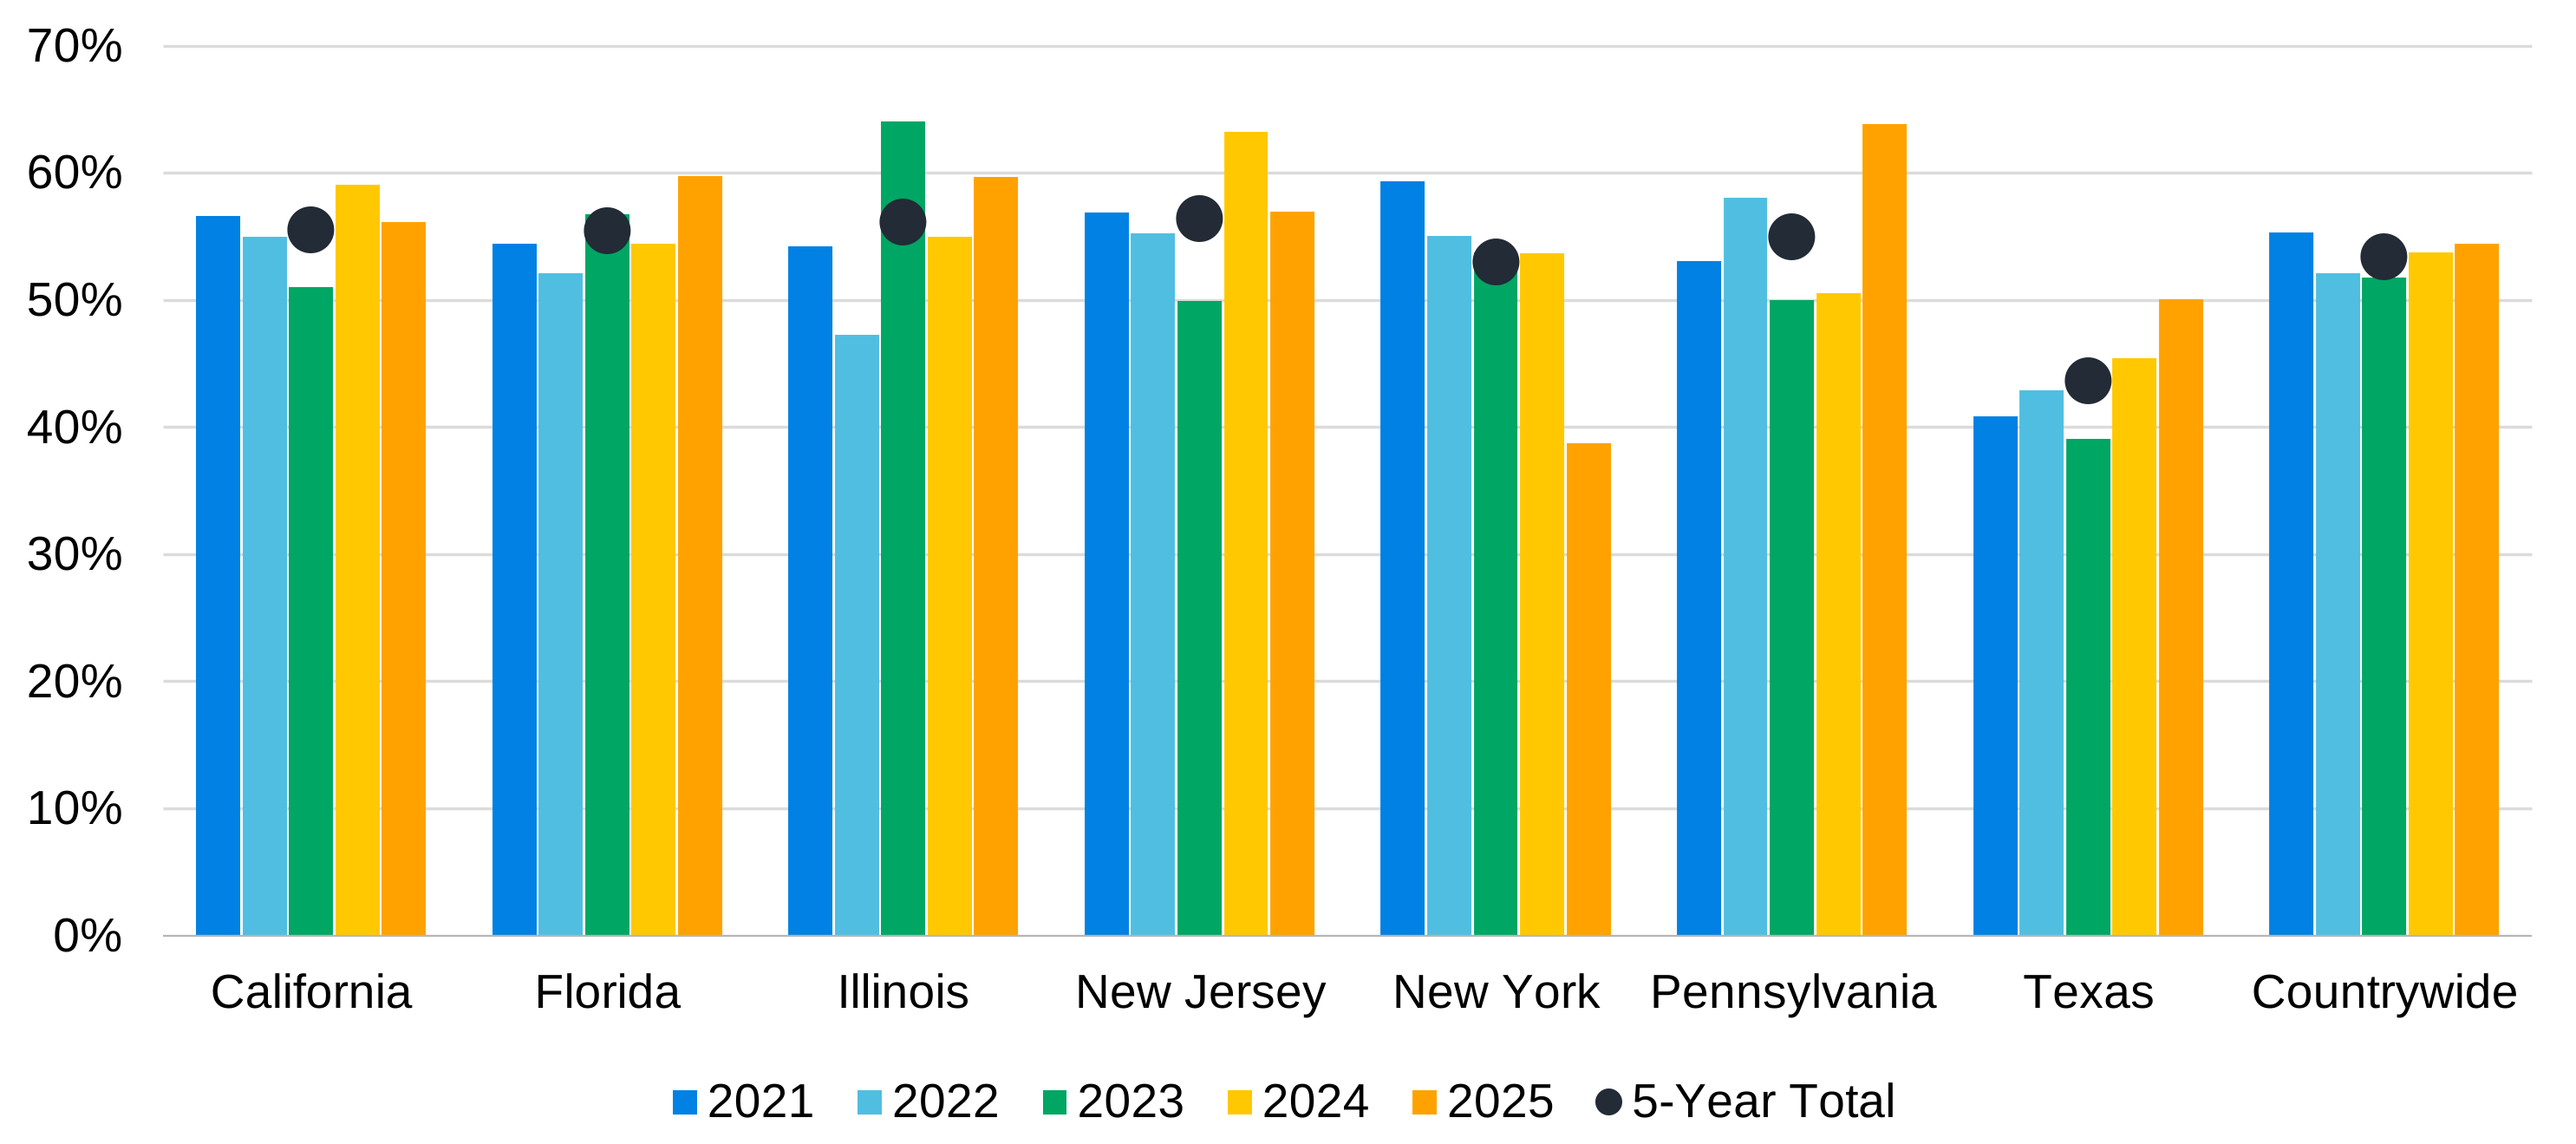
Note: December 31, 2025, data for New York and Pennsylvania state workers’ compensation funds not available at time the data was compiled.
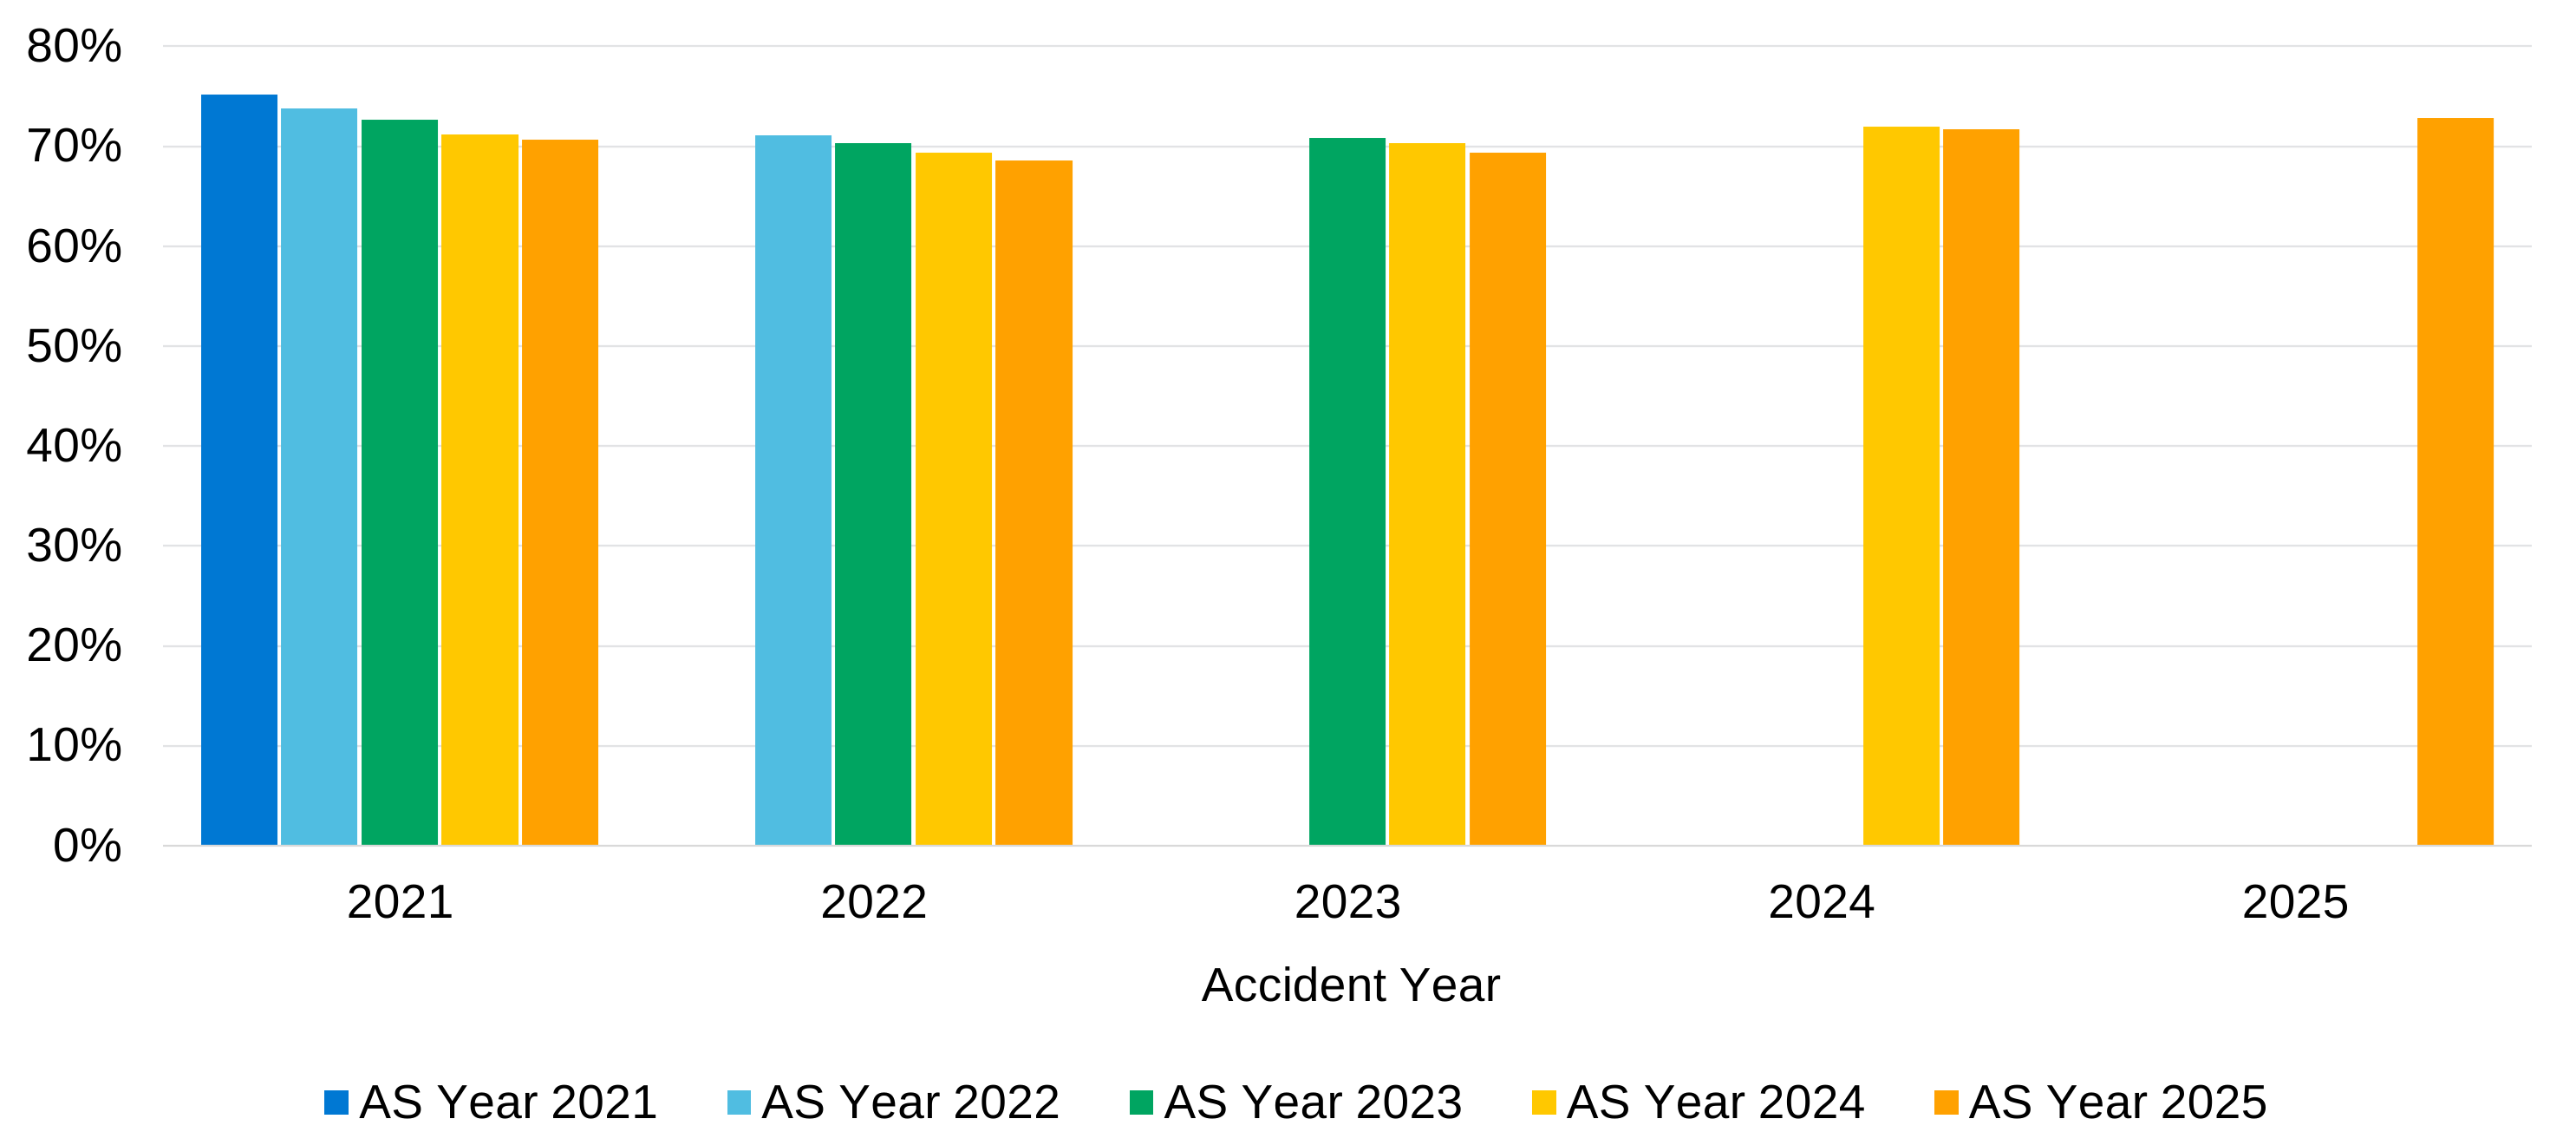
As displayed in Figure 3, the workers’ compensation accident year net ultimate loss and loss adjustment expense (LAE) ratios for this composite have developed favorably from the initial booked estimates for each of the prior four accident years. The initial estimate for accident year 2025 is 72.8%, which is higher than the initial estimate for an accident year net ultimate loss and LAE ratio in the last few years. The median accident year loss ratio in the composite for 2025 is 71.7%, with the middle 50% of companies in this composite between 67.2% and 80.1%.
Figure 3: Top 40 workers’ compensation writers – accident year net ultimate loss and LAE ratio by annual statement (AS) year
Prior-year favorable reserve development continues to outpace industry
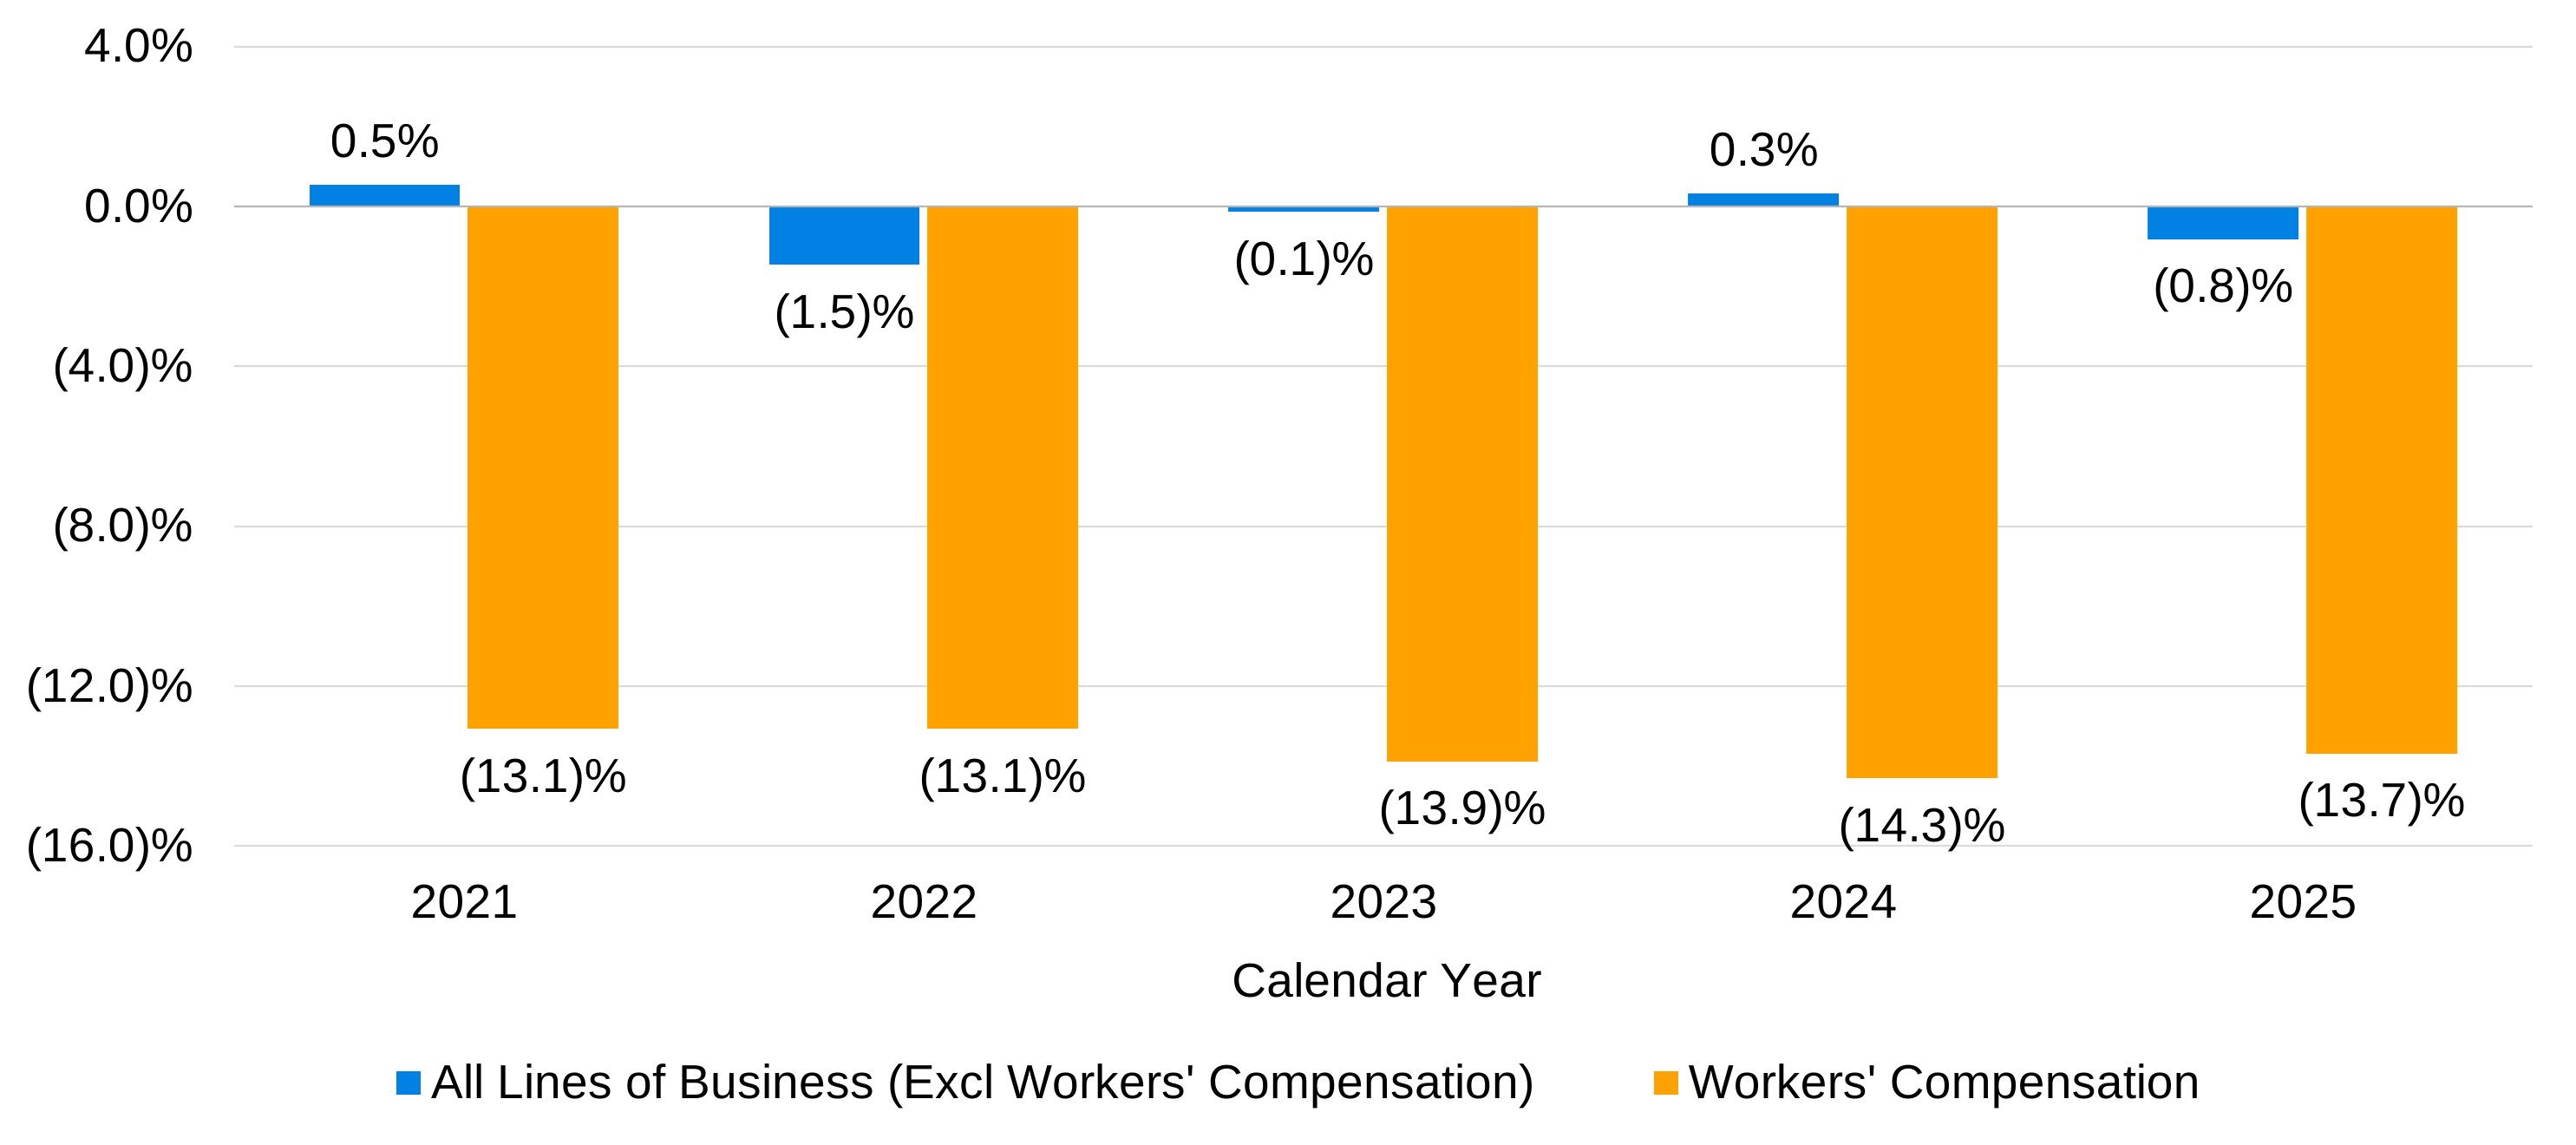
Figure 4 compares this composite’s ratio of one-year reserve development to net earned premium for workers’ compensation to all lines of business excluding workers’ compensation. All lines of business have seen moderate movement in the last five years in either direction for this cohort. Meanwhile, workers’ compensation has seen double-digit favorable one-year reserve development for each of the last five years, significantly outpacing reserve development for other lines of business as insurers release redundancies. Workers’ compensation is a long-tail line of business with considerable uncertainty in future trends, especially medical inflation, changes in medical care, and life expectancies, where changes to any or all these factors could influence future reserve development.
Figure 4: Top 40 workers’ compensation writers – one-year reserve development
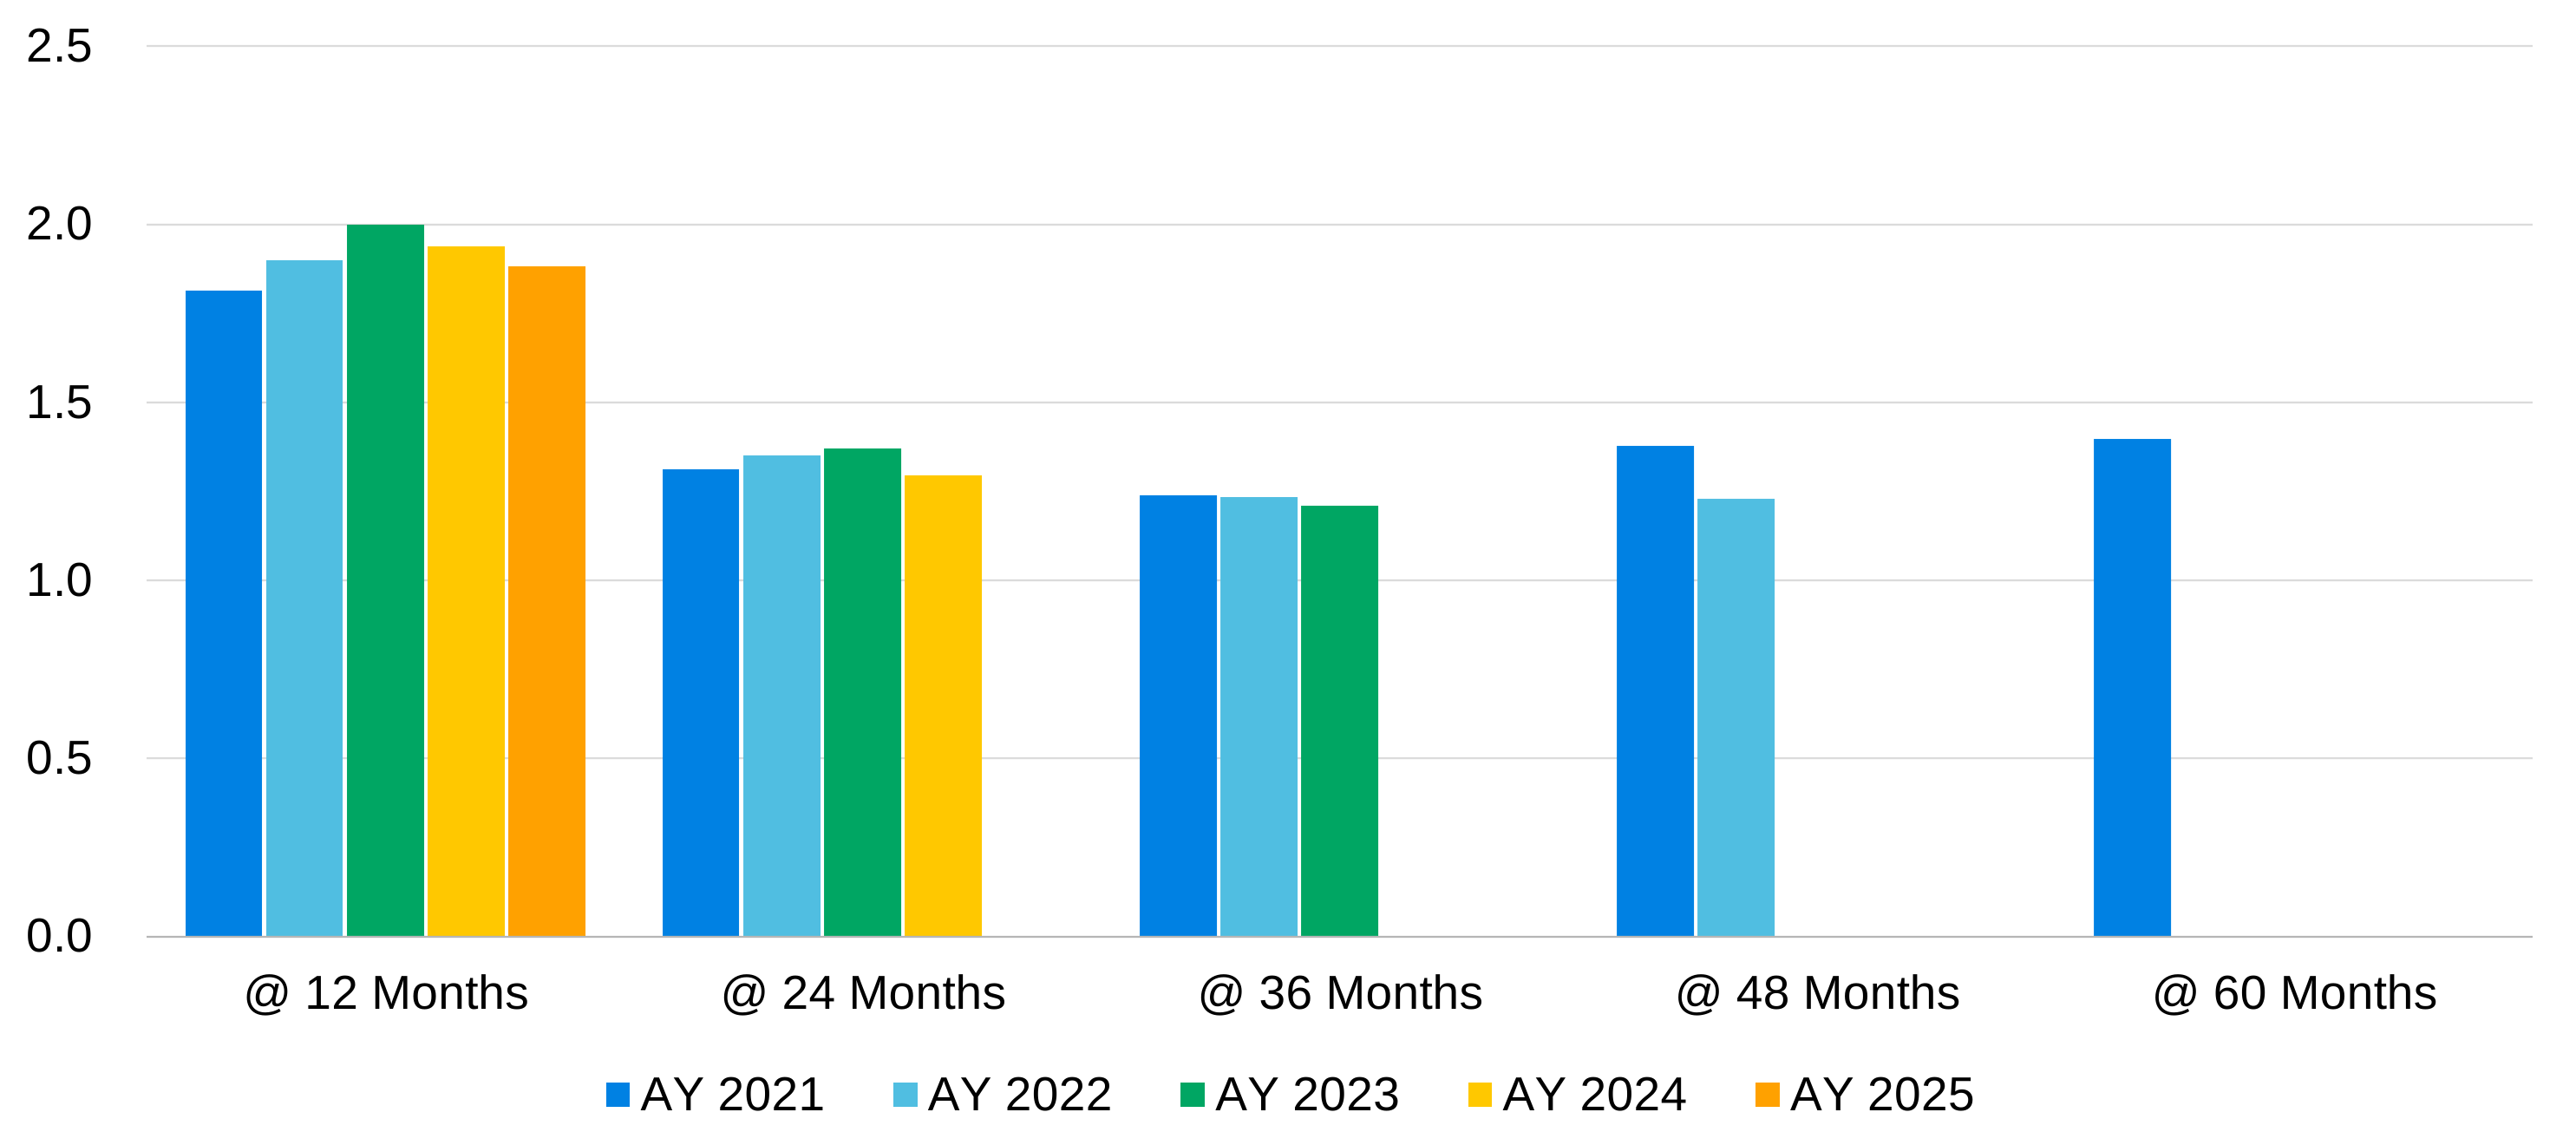
To further assess whether the favorable reserve development might continue, it is useful to look at the incurred by not reported (IBNR)-to-case reserve ratios over time. When initially looking at the ratio from annual statement (AS) year 2025 in Figure 5, one might draw the conclusion that the current year reserves are less adequate than prior years, as the IBNR-to-case ratio is notably lower than past years. However, when the IBNR was restated to reflect the favorable reserve runoff shown previously, the hindsight IBNR to case ratios are more consistent by accident year, as shown in Figure 6. This may imply that the current reserves are adequate and that future favorable development on recent accident years may be less pronounced than it was in prior years.
Figure 5: Top 40 workers’ compensation writers – net IBNR-to-case ratios by AS year
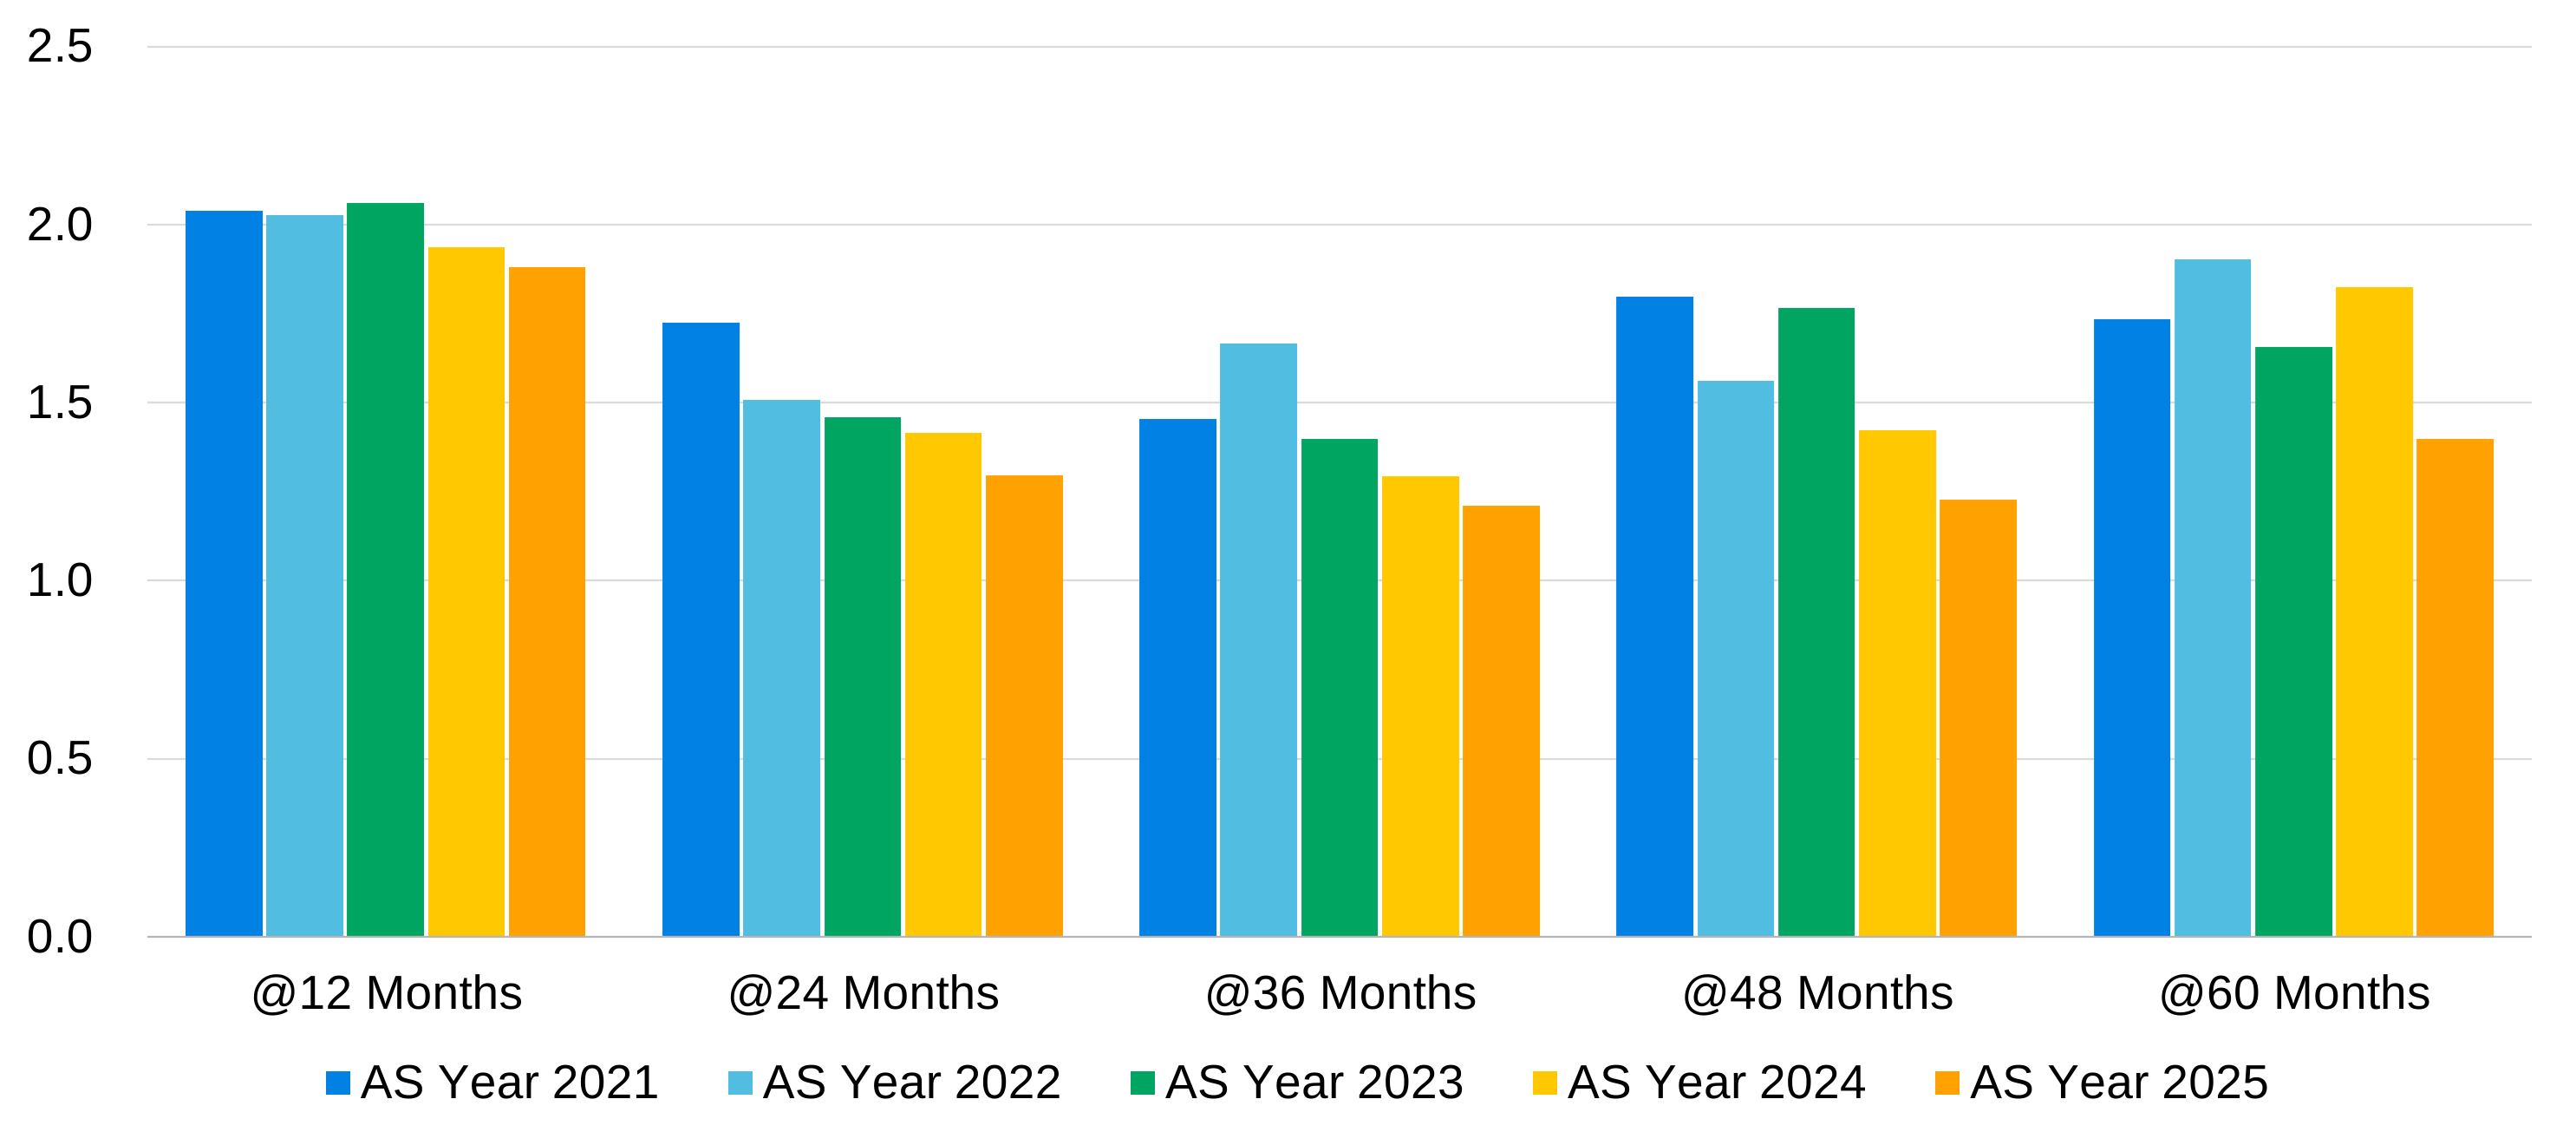
Figure 6: Top 40 workers’ compensation writers – hindsight net IBNR-to-case ratios by accident year
Capital position continues to improve
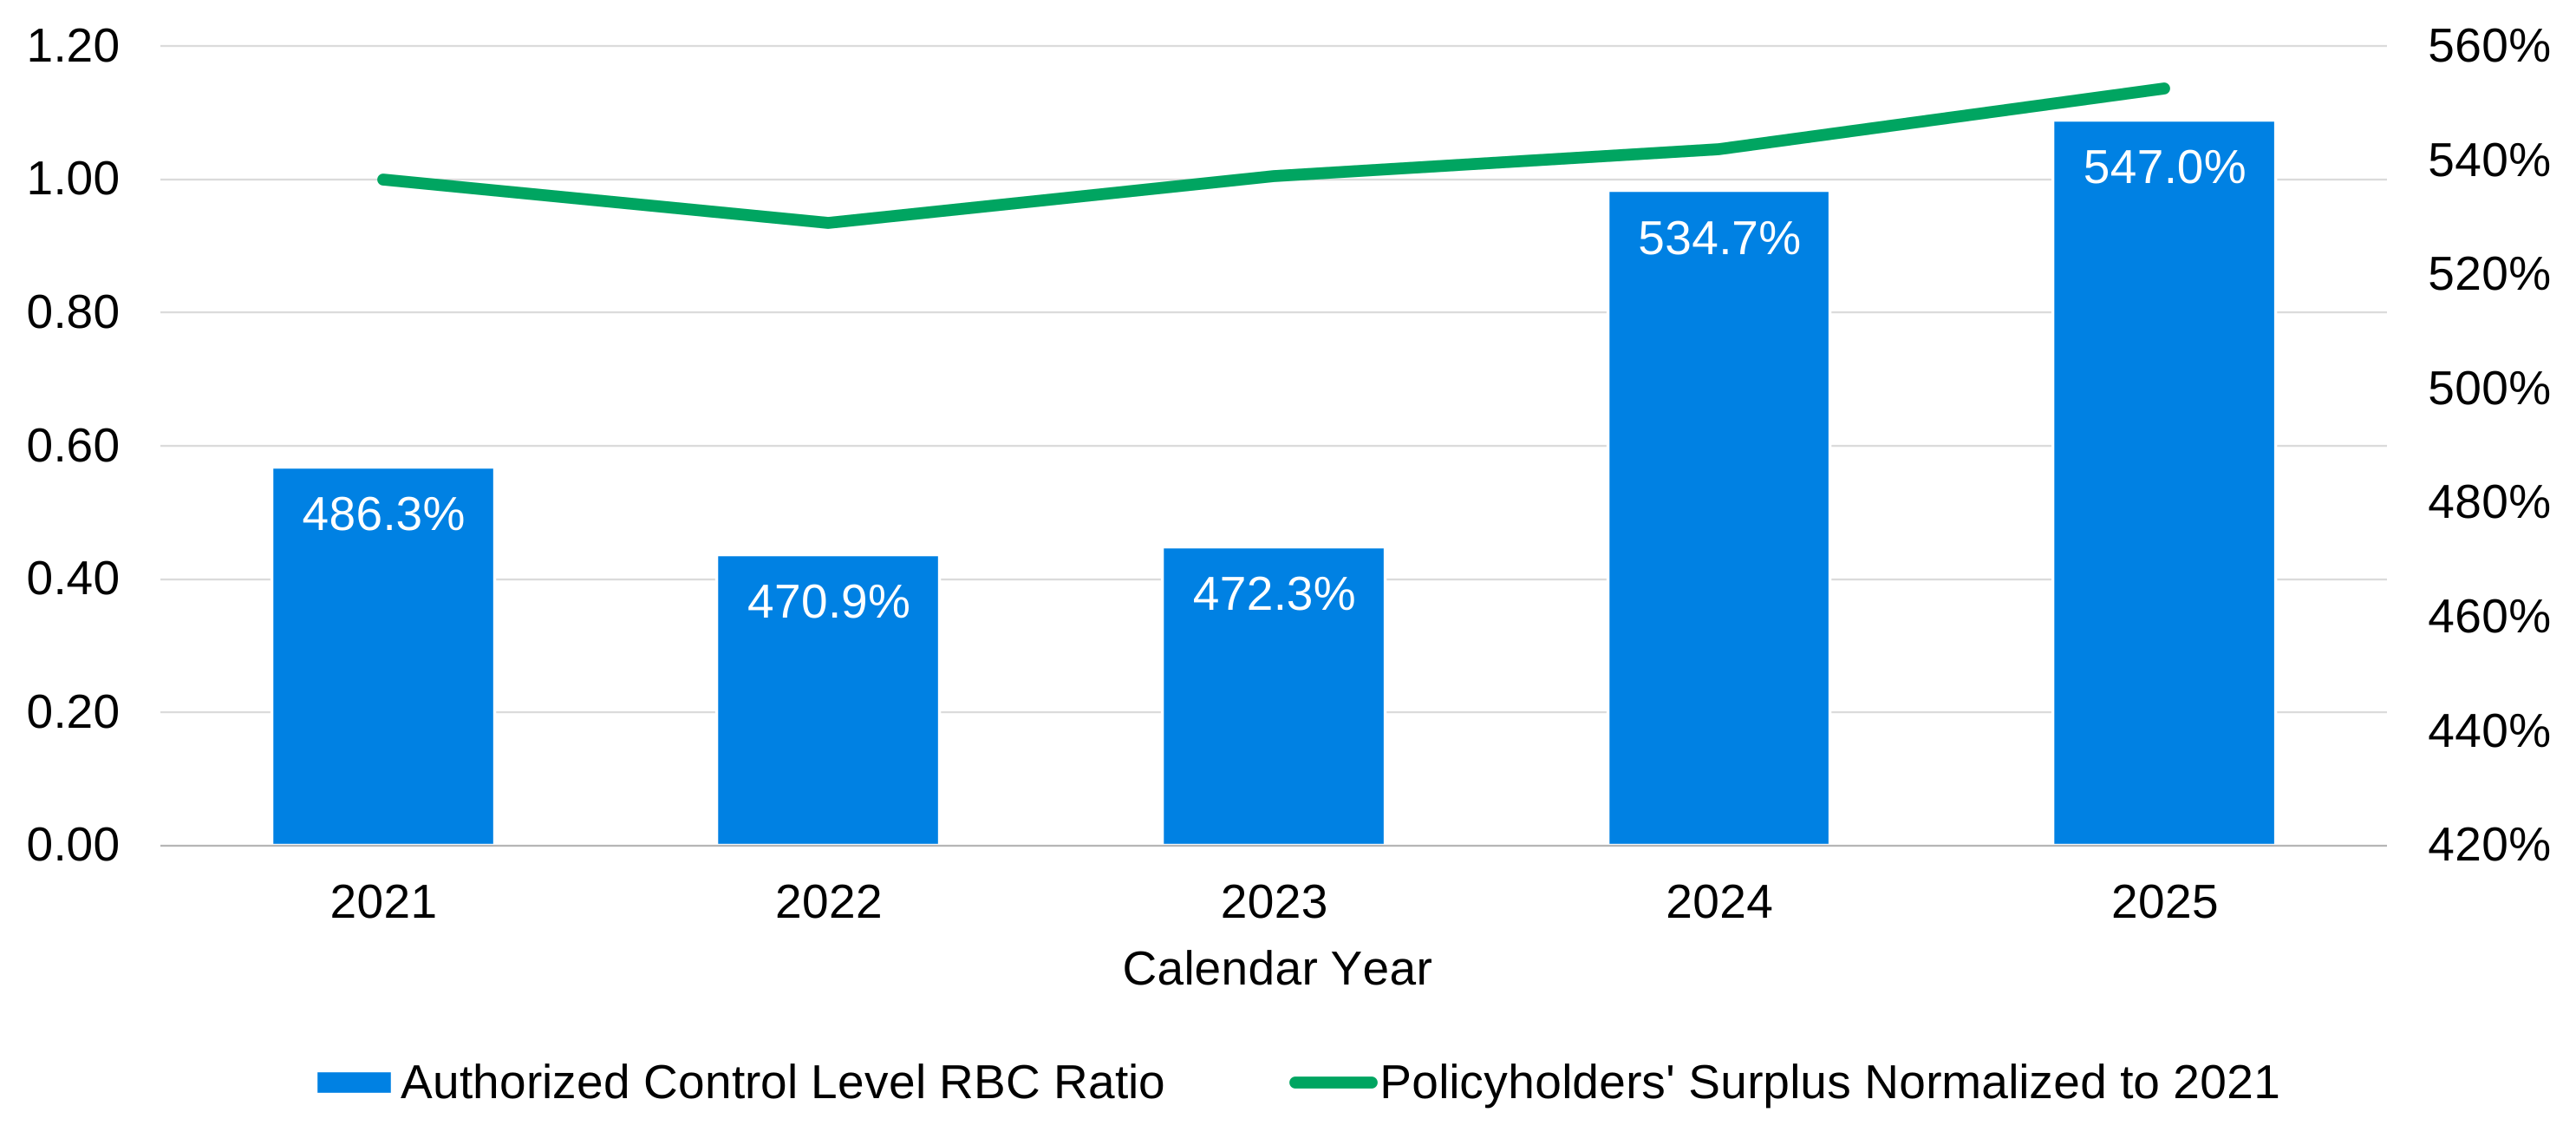
Policyholder surplus (PHS) for the composite increased by 8.7% in 2025, contributing to a cumulative increase of 21.6% since 2022. The decrease in PHS during 2022 can primarily be attributed to changes in macroeconomic factors, such as rising inflation, which led to prominent levels of unrealized capital losses for the entire industry. The increase in PHS since 2022 can largely be credited to a substantial growth in investment income due to the rising financial markets. As can be seen in Figure 7, the rise in PHS since 2022 has led to a substantial increase to the NAIC’s required risk-based capital (RBC) metric. Many of the companies included in this composite write multiple lines of business; therefore, it should not be inferred that the change in capital position for this composite is a direct result of workers’ compensation experience. Figure 7 displays the total PHS change over time, along with the authorized control level RBC ratio for the composite.
Figure 7: Top 40 workers’ compensation writers – capital position
Workers’ compensation in 2026 and beyond
The 2025 statutory financial results for workers’ compensation overall reflect continued stability and favorable results; however, there are some indications potentially suggesting a tempering of favorable expectations in the future, including modest declines in DWP, some deterioration in loss ratios, and possibly less favorable reserve development in the near term. Looking ahead, evolving economic conditions, technological advancements, and legislative changes will continue to impact workers’ compensation, presenting new challenges and opportunities. It is important for companies to not become complacent with the favorable results in recent years but rather continue to carefully monitor emerging trends in order to sustain industry stability in the future.