Risk managers converse in the language of numbers. They speak of tails and betas and deviations. We might naturally ask, then, how useful is this rubric, and how valid are the methods? Which risks can we properly quantify, and how can we understand the many risks we view as qualitative in nature? Can such risks be quantified? Does it even make sense to ask this question?
When considering quantifiable risks, insurers invariably think of contingencies such as mortality and morbidity, or of the many risks related to investing. It is incorrect to assume, however, that risks can be neatly compartmentalized, or that risk is inherently external. On the contrary, risks are interrelated and they are inherently intertwined with operations. Failures may be linked to explicit management decisions, such as aggressive underwriting, or the assumption of mismatch risk. However, catastrophic mistakes are usually indicative of evolving organizational decline. Failure stems more from management's inability to deal with systemic, organizational challenges than from the acutely visible crises.
Whatever the apparent cause, postmortems lead to a sobering revelation: All risk is ultimately management risk. It is the risk of strategic error, of operational blunder, or even of fraud. Nonetheless, as complex as it is, management risk can be monitored, analyzed, and mitigated. This process begins with an understanding of organizational dynamics.
A new breed of analysis
Over the past several years, my colleagues and I have developed techniques to help managers understand and quantify risks that were once considered beyond the realm of analytic technique. The tools discussed here are grounded in the field of network science. They are premised on the realization that organizational risks are inherently internal, and are often structural. While managers need to anticipate and respond to external factors, it is never possible to enumerate all potential contingencies. However, by gaining a meaningful understanding of an organization’s dynamics and capabilities, management can more effectively detect the emergence of risk, and build the type of organizational resiliency required to respond to unanticipated events.
Any assessment of a corporate risk must be founded on an understanding of organizational dynamics. Of course, all companies create organizational charts. Business is managed through formal reporting relationships, committees, ad hoc teams, etc. But to discern how a company really works, it is necessary to analyze the dynamics of the organization at a more fundamental level—what we call its internal organic network, or ION. ION analysis is an essential element of effective risk management. With its focus on the structural implications of the organic corporate organization, ION analysis allows management to mitigate risks and enhance efficiency by gaining an understanding of:
- Centers of power and influence
- Potential bottlenecks
- Underutilized or redundant resources
- Measures of brittleness and resiliency
- Potential synergies
- Viability of mergers or management restructuring
The three pillars of ION analysis are discussed below. In the first step, we construct a snapshot of the ION at a given moment. Development is supported by combining survey information with data on corporate communications, such as may be available in email archives. Additional information is derived by monitoring the evolution of the ION over time. Finally, insights can be enhanced by developing a variety of quantitative and qualitative analyses regarding a company’s interactions with external entities such as clients, regulators, suppliers, and even competitors.
Point-in-time structural analysis
Point-in-time structural analysis examines company structure based on email or other interactions over a fixed period, such as one week or one month. When a business is cyclical in nature, it is ideal to monitor activity over several full cycles. Point-in-time structural analysis highlights issues related to connectivity, efficiency of corporate communications, and organizational vulnerability. When supplemented with natural language algorithms to evaluate content, it is possible to identify company knowledge centers, and to facilitate efforts that may reduce workload bottlenecks or promote synergies.
Dynamic monitoring
Through periodic application of point-in-time analysis, dynamic monitoring develops time series trends, enabling management to monitor emerging issues. Through the dynamic monitoring process, Milliman techniques support the identification of work-flow hot spots, organizational anomalies, and underutilized resources.
External analyses
Important information is embedded in corporate correspondence with external parties. Analyses of external/internal metrics and the nature of external communications help to frame the ION analysis in a broader context.
Illustration
To illustrate some of these concepts, we look at the case of a hypothetical rapidly growing boutique reinsurer whose clients are mainly North American or European multinationals.
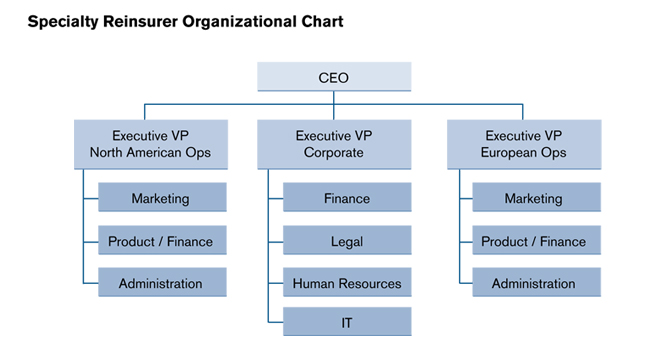
Structure as represented by standard organizational charts
The official organization chart for this reinsurer, shown in the diagram in Figure 1, reflects operations divided into European and North American units, both of which are responsible for local marketing, product design, and administration. A corporate unit coordinates activities, is responsible for financial reporting and risk management, and provides legal, HR, and IT services.
Figure 1
Through ION analysis, we will examine the implications of two variations in corporate organization. At first glance, the difference in structures appears quite minor, but the analysis will reveal important implications.
Under Organization 1, corporate finance has five professional employees: a VP of finance, an actuary, and three additional accounting professionals. The corporate finance organization can be represented by the simple tree shown in Figure 2.
Figure 2
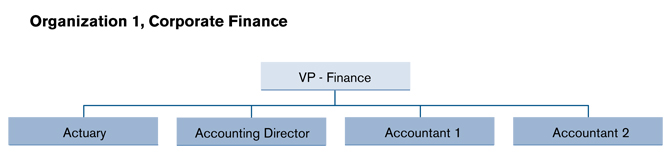
Under this approach, the VP of finance plays an essential role in coordinating activities among the corporate unit, North American operations, and European operations. The four junior professionals report directly to the VP of finance, and have quite narrowly defined roles. As we will see when we develop the ION, this structure embodies significant risk.
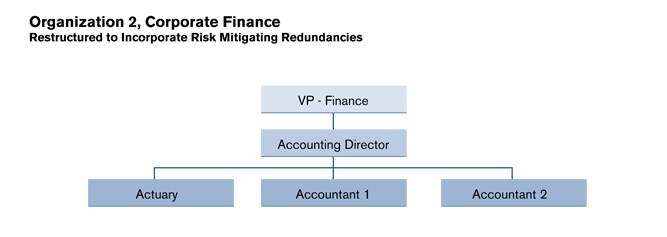
Under Organization 2, there is exactly one change in management structure and a corresponding change in philosophy. One of the accounting professionals, the accounting director, is given an expanded role. With the revised structure, the accounting director is responsible for functions similar to those under Organization 1, but now shares higher-level management responsibilities with the VP of finance. This builds in an important redundancy, as will be clear from the ION analysis.
The modified chart for corporate finance is shown in Figure 3.
Figure 3
Structure of the ION
Within any organization, human interactions over time result in the emergence of a social network—an association of people drawn together by common interests. Social networks evolve organically, without top-down guidance. Therefore, their channels of communication may differ materially from those defined by the official organization. People who are close to each other within a social network are likely to share ideas and communicate effectively with one another. The essence of ION analysis is to gain an understanding of this organic network, and to study the implications as they relate to efficiency, risk, and the achievement of management goals.
The following graphs depict the IONs that have emerged over time within the two organizations discussed above:
Figure 4
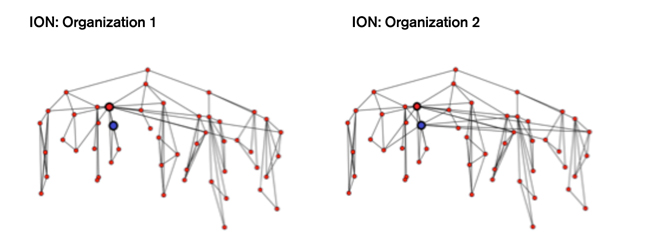
In these graphs, the CEO is placed at the top of the chart, and edges generally reflect the seniority of each employee. The large red node represents the VP of finance, and the large blue node the accounting director.
The graph structures for the two cases are qualitatively similar. Both are tree-like, suggesting that the official organizational chart has influenced the evolution of the ION. Nonetheless, in both cases, there is considerable lateral connectivity uniting the corporate area in the central part of the graph with the two geographic units to the left and right.
Closer scrutiny reveals one important difference. Under Organization 1, all of the connectivity between the corporate function and the business units flows through the VP of finance. This is clearly a key individual, a center of power. Concentrating communications through this single person entails risks of work-flow bottlenecks and of business disruption if the individual is disabled or leaves the company.
This risk is illustrated in the following graphs, which depict each organization under the assumption that the VP of finance has left the company, and has been replaced by an individual who assumes similar responsibilities, but, being new to the organization, has few organic connections.
Figure 5
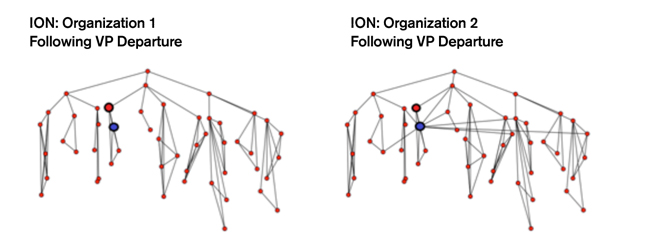
Following the departure of the VP of finance, the graphs are now qualitatively very different. Because the second structure possesses important built-in redundancies, the graph for Organization 2 retains lateral connectivity. The graph for Organization 1 has lost this connectivity, with important implications for communication and work flow.
These observations can be verified by calculating various ION graph metrics, which are summarized in the table in Figure 6:
Figure 6: ION Metrics
| Metric |
Org. 1 Base
|
Org. 1 VP Resigns
|
Org. 2 Base
|
Org. 2 VP Resigns
|
| Average Degree |
3.7
|
3.3
|
3.9
|
3.6
|
| Diameter |
5
|
6
|
5
|
6
|
| Char. Path Length |
3.1
|
4.4
|
3.1
|
3.7
|
| Graph Entropy |
1.7
|
1.6
|
1.8
|
1.7
|
In the table in Figure 6, we focus on the metric described as characteristic path length. This is a measure of the degree of connectivity within an organization, and, along with other measures, can be used to assess the efficiency of communications.
Under Organization 1, the resignation of the VP of finance leads to a dramatic increase in the characteristic path length, verifying our prior visual observations. While the characteristic path length does increase in the case of Organization 2, the increase is less severe.
The observations outlined above were developed through what is in essence a scenario-testing technique. The visual and numerical analyses help us to test the implications of changing elements of organizational design. This process helps us uncover weakness and potential risk management issues. Similar techniques can help identify positives, such as potential synergies and efficiency enhancements.
Certain graph metrics, for example those related to the concept of centrality, may also be used to flag potential issues. Centrality measures offer insight into the degree to which information in an organization flows through particular individuals, departments, or business units.
In the table in Figure 7, under Organization 1, we have calculated a specific centrality measure known as betweenness centrality for the seven most senior individuals in the company:
Figure 7: Organization 1, Betweenness Centrality
| Senior Executive |
Betweenness Centrality
|
| CEO |
0.02
|
| EVP – North American Ops |
0.03
|
| EVP – Corporate |
0.06
|
| EVP – European Ops |
0.07
|
| VP – North American Marketing |
0.16
|
| VP – Finance |
0.74
|
| VP – European Marketing |
0.24
|
The betweenness centrality metric clearly identifies the VP of finance as an outlier and potential risk.
Concluding remarks
Even a relatively simple exercise in ION analysis such as the one illustrated above can enhance our understanding of the risks embedded in an organization, and can point to corrective measures. ION analysis will often begin with the development of a broad, global view of the organization, followed by a more detailed review of critical components or issues that emerge. Once an initial snapshot is developed, a periodic monitoring of the ION over time can provide valuable, ongoing insights.
In addition to supporting internal management efforts, ION analysis can help explain corporate structure and associated risk management implications to external parties such as regulators, rating agencies, or industry analysts. It can also facilitate the evaluation of management reorganization proposals and succession planning.
While ION analysis can generate valuable insights regardless of business sector, a variety of applications can be tailored to the insurance industry. Questions that can be addressed span the entire business. Are underwriters effectively communicating with product and marketing professionals? Is there a good balance between the generation of new business and provision of quality service on the existing portfolio? Are investment professionals staying in close touch with product innovation?
We believe that network science techniques will soon move into the mainstream of risk management, allowing organizations to understand, monitor, and manage risks in a comprehensive manner. These techniques will facilitate not only risk identification, but also the pursuit of proactive measures that build organizational resiliency and enhance overall efficiencies.